Message: unserialize(): Error at offset 0 of 217 bytes
Filename: english/geoplugin.class.php
Line Number: 92
A PHP Error was encountered
Severity: Notice
Message: Trying to access array offset on value of type bool
Filename: english/geoplugin.class.php
Line Number: 96
A PHP Error was encountered
Severity: Notice
Message: Trying to access array offset on value of type bool
Filename: english/geoplugin.class.php
Line Number: 97
A PHP Error was encountered
Severity: Notice
Message: Trying to access array offset on value of type bool
Filename: english/geoplugin.class.php
Line Number: 98
A PHP Error was encountered
Severity: Notice
Message: Trying to access array offset on value of type bool
Filename: english/geoplugin.class.php
Line Number: 99
A PHP Error was encountered
Severity: Notice
Message: Trying to access array offset on value of type bool
Filename: english/geoplugin.class.php
Line Number: 100
A PHP Error was encountered
Severity: Notice
Message: Trying to access array offset on value of type bool
Filename: english/geoplugin.class.php
Line Number: 101
A PHP Error was encountered
Severity: Notice
Message: Trying to access array offset on value of type bool
Filename: english/geoplugin.class.php
Line Number: 102
A PHP Error was encountered
Severity: Notice
Message: Trying to access array offset on value of type bool
Filename: english/geoplugin.class.php
Line Number: 103
A PHP Error was encountered
Severity: Notice
Message: Trying to access array offset on value of type bool
Filename: english/geoplugin.class.php
Line Number: 104
A PHP Error was encountered
Severity: Notice
Message: Trying to access array offset on value of type bool
Filename: english/geoplugin.class.php
Line Number: 105
A PHP Error was encountered
Severity: Notice
Message: Trying to access array offset on value of type bool
Filename: english/geoplugin.class.php
Line Number: 106
A PHP Error was encountered
Severity: Notice
Message: Trying to access array offset on value of type bool
Filename: english/geoplugin.class.php
Line Number: 107
A PHP Error was encountered
Severity: Notice
Message: Trying to access array offset on value of type bool
Filename: english/geoplugin.class.php
Line Number: 108
A PHP Error was encountered
Severity: Notice
Message: Trying to access array offset on value of type bool
Filename: english/geoplugin.class.php
Line Number: 109
A PHP Error was encountered
Severity: Notice
Message: Trying to access array offset on value of type bool
Filename: english/geoplugin.class.php
Line Number: 110
A PHP Error was encountered
Severity: Notice
Message: Trying to access array offset on value of type bool
Filename: english/geoplugin.class.php
Line Number: 111
A PHP Error was encountered
Severity: Notice
Message: Trying to access array offset on value of type bool
Filename: english/geoplugin.class.php
Line Number: 112
A PHP Error was encountered
Severity: Notice
Message: Trying to access array offset on value of type bool
Filename: english/geoplugin.class.php
Line Number: 113
A PHP Error was encountered
Severity: Warning
Message: Cannot modify header information - headers already sent by (output started at /home/qz3sdqmo7yci/public_html/sparkacademy.us/system/core/Exceptions.php:185)
Data Science is evolving at lightning speed to become the hottest field in the computer science or technology industry.
However, for a beginner, it can be very tricky to learn the know-how of data science projects like how to start, proper steps to follow, etc. So, in this blog, we will provide the details of the data science lifecycle that can be easily adapted into any data science project.
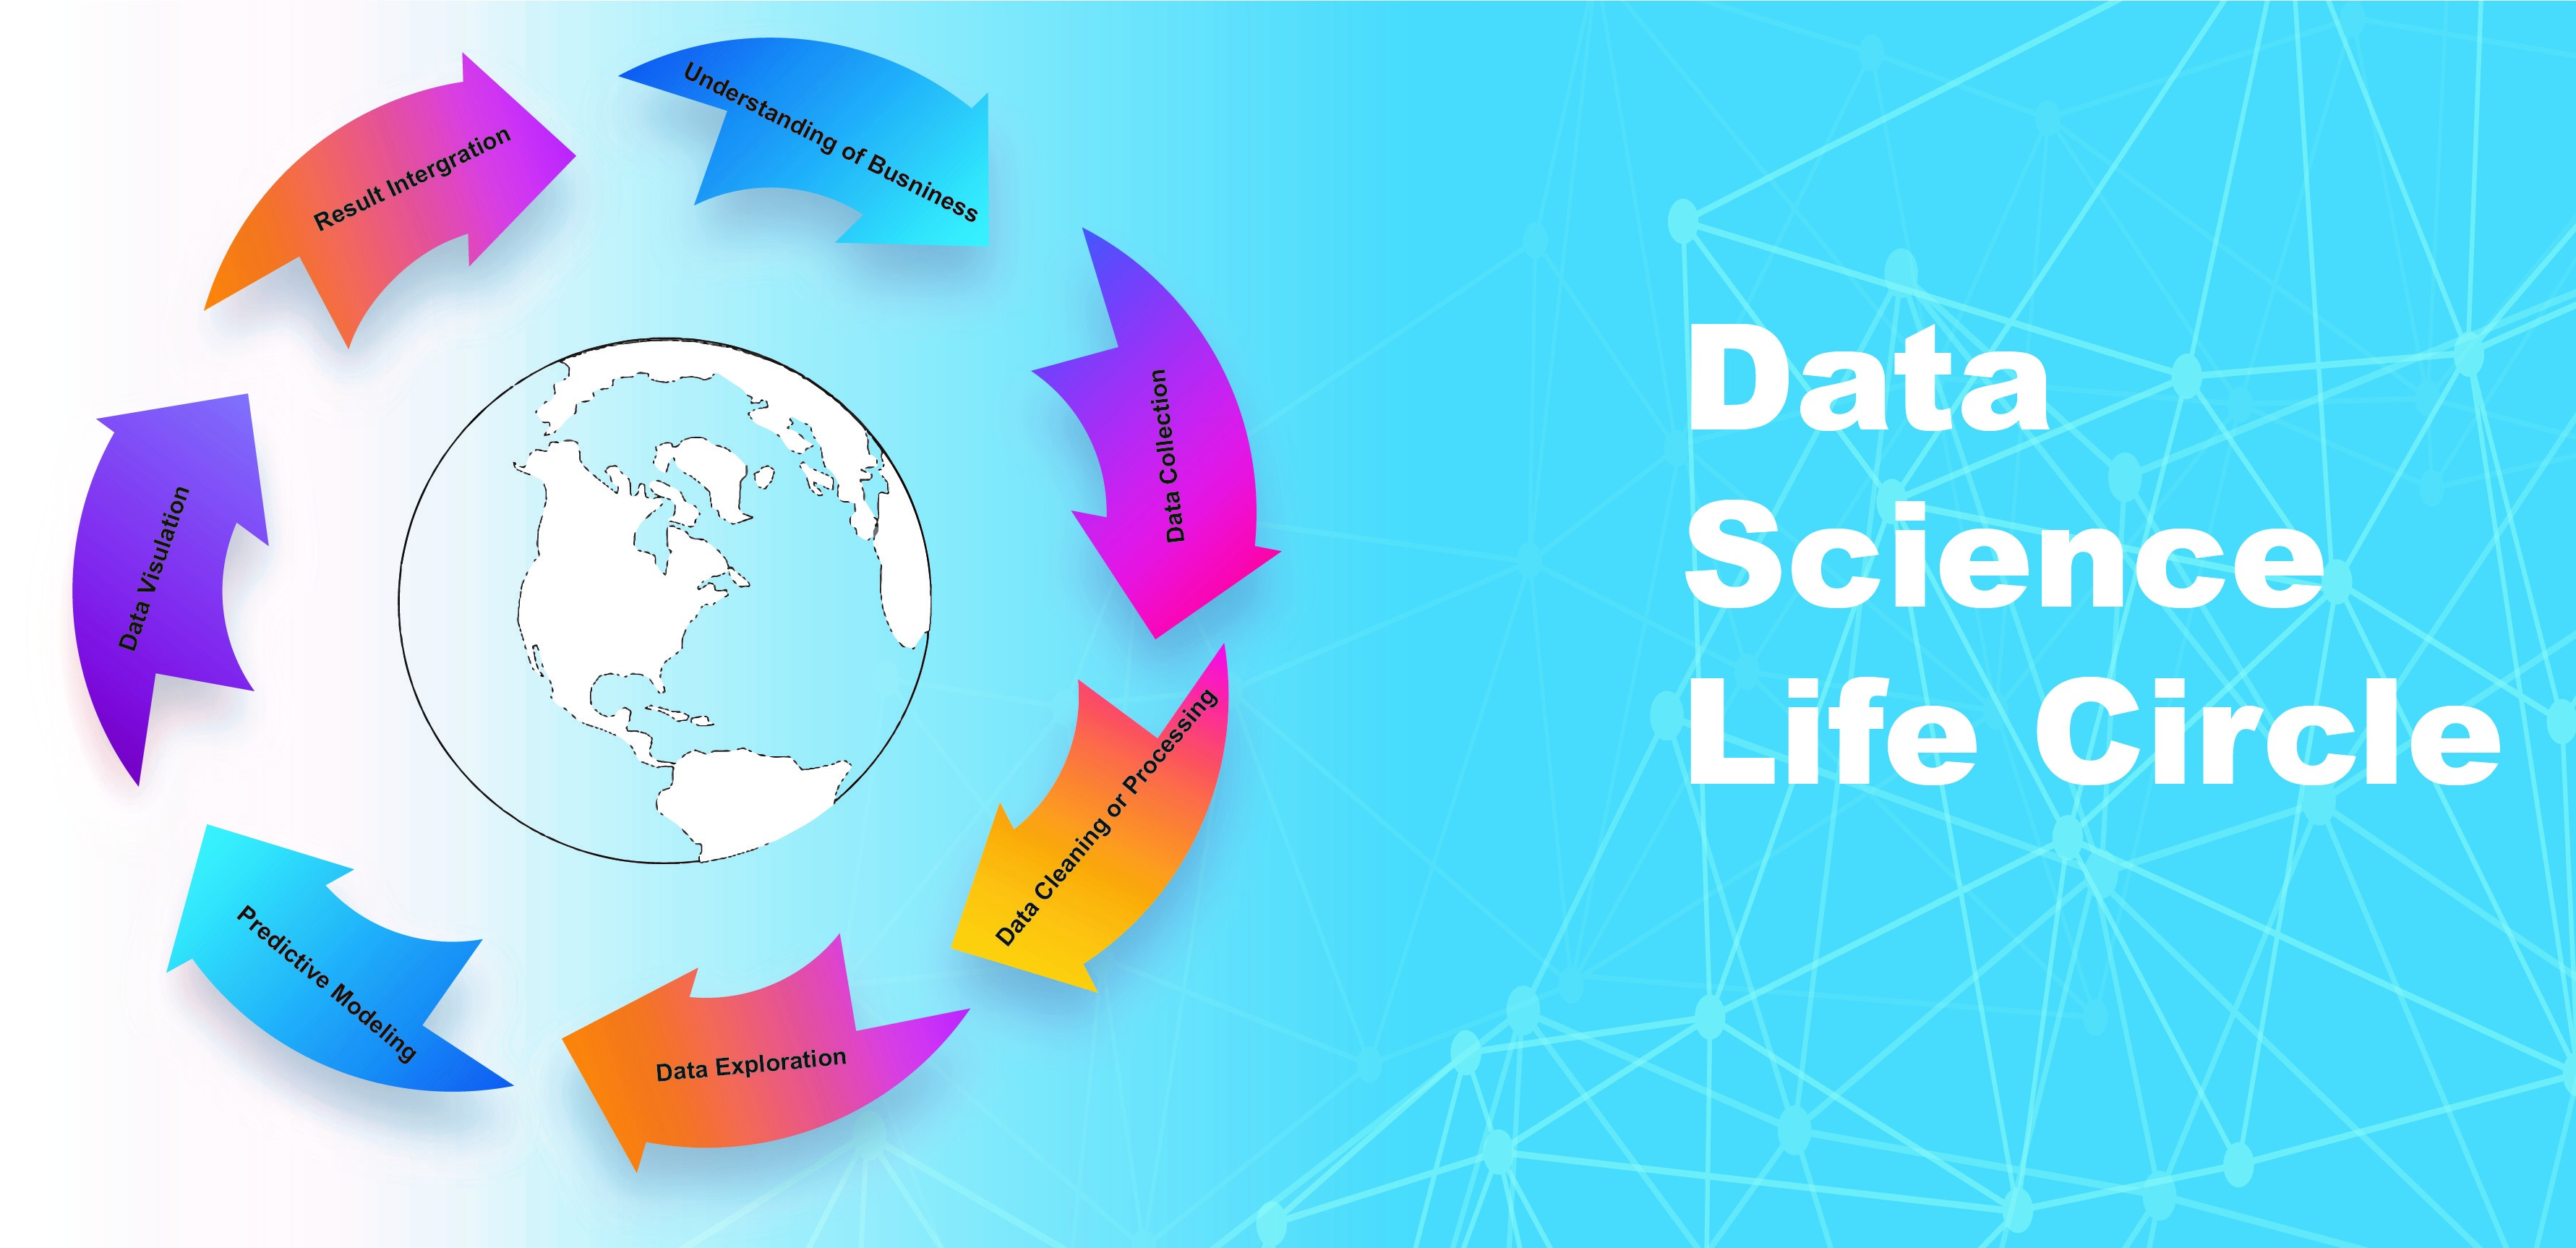
Intro To Data Science Lifecycle
A Data science lifecycle defines the steps in any data science project. A data science workflow should always be followed by data scientists when they work with big data. But anyhow whether a data scientist wants to perform analysis to deliver a story by the method of data visualization or wants to simply build a data model - data science workflow operation matters a lot.
An Existing standard workflow for data science projects confirms that the different teams in an organization are in sync, so that any more delays can be evaded. The end target of any data science project is to develop a value-based data product.
The functional results produced towards the end of the data project is known as a data product. The data product can be classified as anything namely -a dashboard, an engine for suggestions and recommendations or anything that facilitates business decision-making) to solve a business problem.
However, to reach the end goal of the data production process, data scientists have to go through a formalized gradual workflow process. The data science lifecycle of projects should not mainly focus on the process but should lay more emphasis on the efficiency of data products. Here, the standard workflow process of projects related to data science is detailed. This should be followed by all data scientists.
Data Science Life Cycle Steps
1.Understanding of Business
2. Data Collection
3. Data Cleaning Or Processing
4. Data Exploration
5. Predictive Modeling
6. Data Visualization
7. Result Integration
a. Building a model Pipeline
b. Training the model
c. Packaging the API
Let’s Start Understanding Each Step Of Data Science Lifecycle
1. Understanding of Business Issue
While we are solving a problem, there should be a high level of understanding of the depth of the issue, else in the end the solution will come out as irrelevant to the original problem.
There are certain sets of questions listed below to be asked before starting to solve the problem.
How much to analyze
Which Category Or Classification
Group Or Cluster
Outlier OR Not
Alternative to Take Up OR Recommendation
The classification of the central objectives of your project by the identification of variables that is to be predicted. If considering a regression, it could be similar to a sales forecast. When it’s clustering, it could be a profile of a customer. Comprehending the power of data and how you can use it to derive results for your organization by asking the perfect questions is an art rather than science, and to do this right one needs to gain a lot of experience. You can start with the data science course now to master these skills and apply knowledge in live projects to gain experience here (click here)
2. Data Collection
After classifying the problem, we are trying to solve, there is a need for the collection of data that can be utilized in the further steps of problem-solving. The role of Data collection is a very crucial step in the entire Data Science life cycle. It is a hugely important step because data is the core of any data science project. Hence, the quality of data matters a lot for the ultimate results. But the data we collect can majorly have several critical issues like it can be faulty, incorrect, or incomplete to solve the given problem. Data is always gathered from multiple sources for studying and analyzing so it can be inconsistent. Because of this diverse source of data, there can arise huge problems of data combination or merging data to form a huge data set. There should be utmost importance given to data sources, which should be genuine and reliable.
All the different measures should be taken to make sure that the data is of high quality. The sources of the data can be from customer surveys and ratings or reviews. By taking up data directly from customers, data quality is ensured of it’s genuineness. Also, there are some other sources for data that can be used for data extraction such as websites utilizing web scraping, where data can be easily extracted from web pages. Once the data collection is done efficiently, you can move towards the next steps of the data science life cycle.
3. Data Cleaning OR Processing
As we have secured all the necessary data, we move ahead to the prolonged next step - cleaning and processing the data. This is a very tedious task where big data is involved with terabytes of raw data. According to several interviews with data scientists, this process can frequently take around 50 to 80 percent of their time while executing projects. So let’s try to find out why it's such a lengthy process? The reason here is simple because there are so many possibilities that are involved in cleaning. For example, the data could have multiple inconsistencies within a similar column, which means that some rows could be categorized 0 or 1, and others could be categorized Yes or No. Then again the data types could also be more inconsistent such as some of the 0s may be integers, whereas some may be strings. The categories of different data types may have spell errors OR there can be data sets for gender where male and MALE both will be categorized as a different set. So these mistakes should be instantly caught and fixed.
Always remember to focus your attention on missing data. It’s because it can cause a lot of problems later on. Missing data can cause huge errors in the model creation and training. One of the best options is to either completely ignore the instances which contain any missing values. You should not depend on your dataset, as this could be unrealistic if you have too many missing data. Another best-known approach is to utilize something namely average imputation, which replaces missing values with the average of all other instances. This process is not usually recommended as it can reduce the variability of the data, but in some cases it is useful.
4 Data Exploration
Now after you have got a clean set of data, you’re ready to finally start your analysis. This stage known as the data exploration branch is informally called as brainstorming of data analysis. This is the stage where you easily understand the patterns and biases in your data. It could certainly entail pulling up and analyzing a random data subset utilizing Pandas, plotting a distribution curve or histogram to see the main trend, or even develop an interactive visualization that lets you deepdive into each data point and inspect the history behind the outliers. Using all of the information, start with the formation of hypotheses about your data and the issues you are about to tackle. For example, If you were predicting scores of students then you could try visualizing the correlation between scores and sleep patterns. If you were predicting property prices, you could perhaps place the prices as a heat map on a spatial plot to look out if you can probably seize any trends.
To learn about exploratory data analysis tools you can refer to the course here(click here)
5. Predictive Modeling
Predictive modeling is where the famous subject machine learning finally enters into your data science project. The term predictive modeling means that a good project is not one that only trains a model and extensively focuses on accuracy, considers comprehensive statistical methods and appropriate tests to ensure that the results from the model actually make significant sense. Depending on the queries asked by you in the business understanding stage, this is the particular stage where you select which model to select for your problem. This process is complicated without a fixed answer to it. The multiple models that you end up training will depend on the size, range, type and quality of overall data, the actual time and computational resources you are ready to invest, and the sort of output you plan to derive.
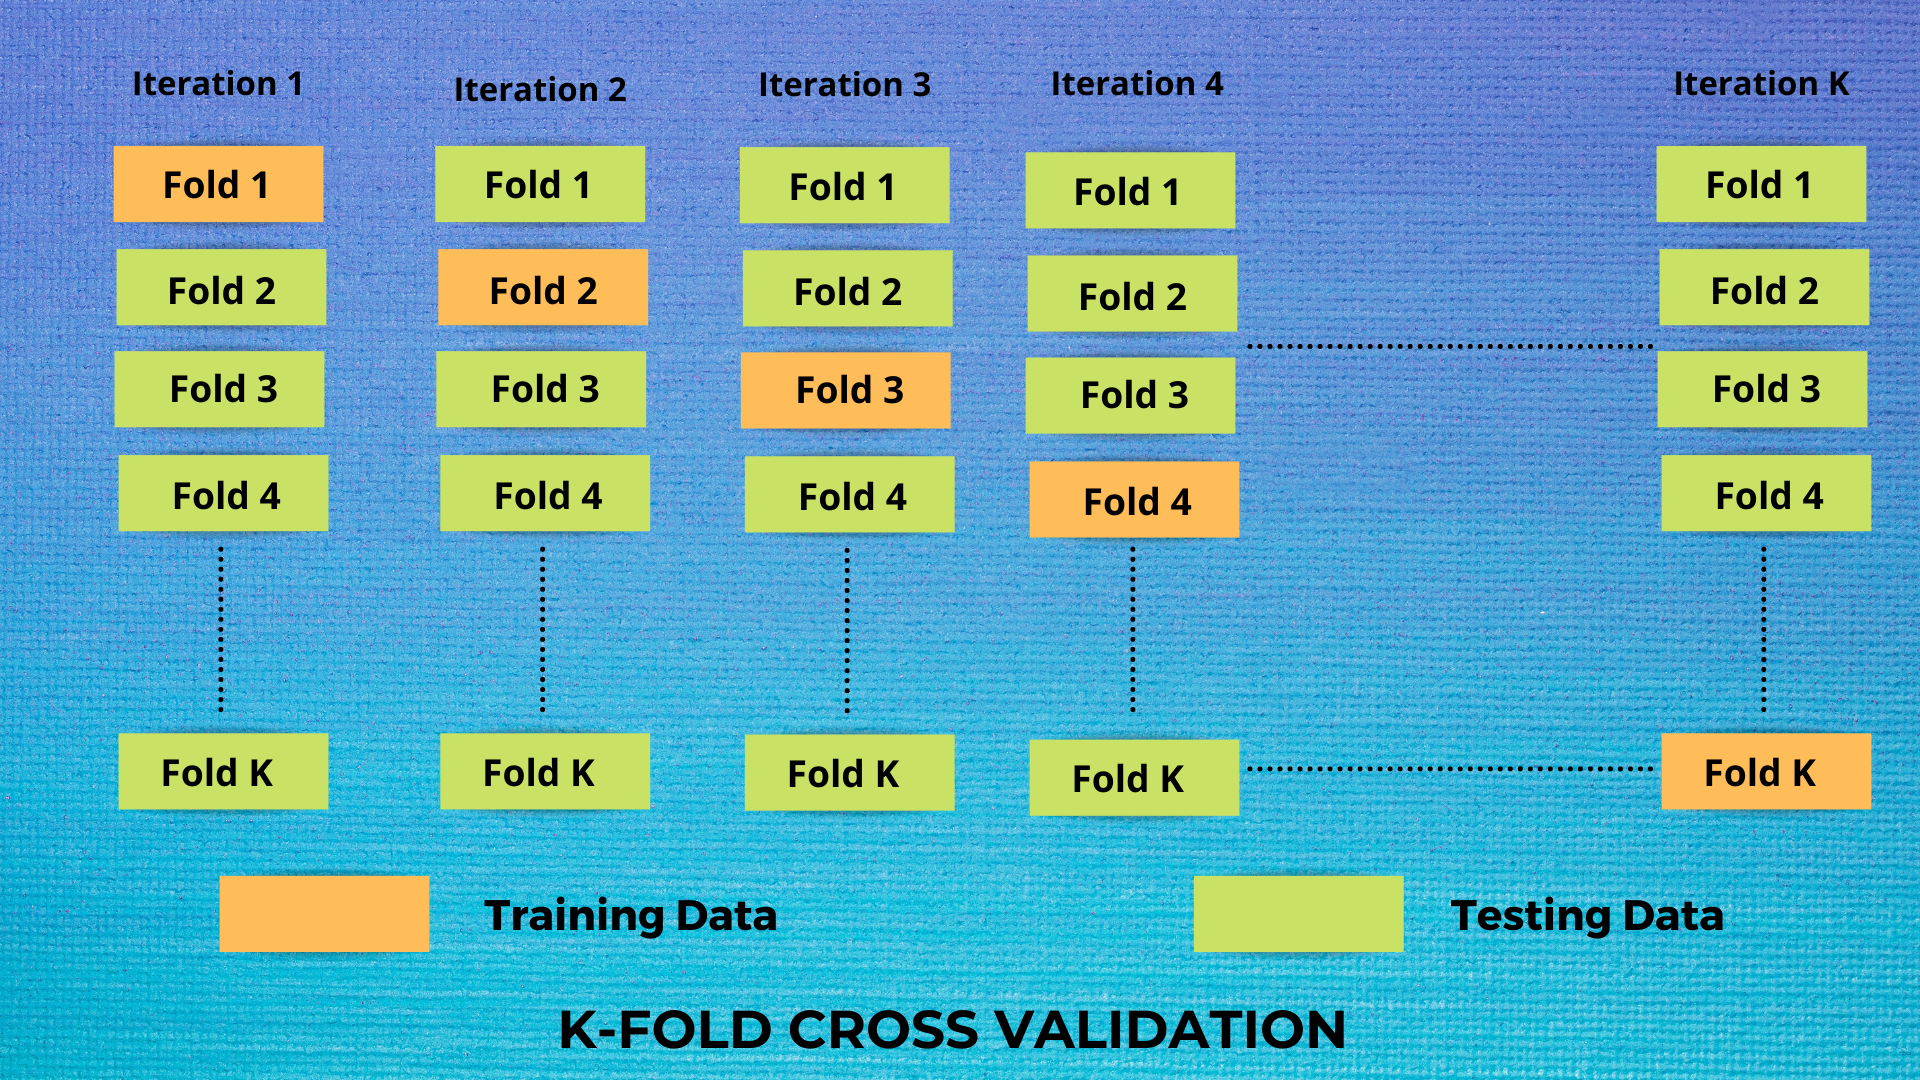
Once you’ve actually trained your model, it is very crucial that you must evaluate its success. A process known as k-fold cross-validation is majorly used to compute the accuracy of any model. It requires dividing the dataset into k equally sized parts of instances, training on all the existing groups except one, and repeating the process with other groups left. This way all models are allowed to be trained on all the data instead of utilizing a standard train-test split. For classification models, a common way to test accuracy is by using PCC (percent correct classification), alongside a confusion matrix that breaks down the errors into false positives as well as negatives. Plots such as ROC curves are also used as a benchmark for the success of a model. For a regression model, the common metrics include the coefficient of determination, mean squared error (MSE), and average absolute error.
6. Data Visualization
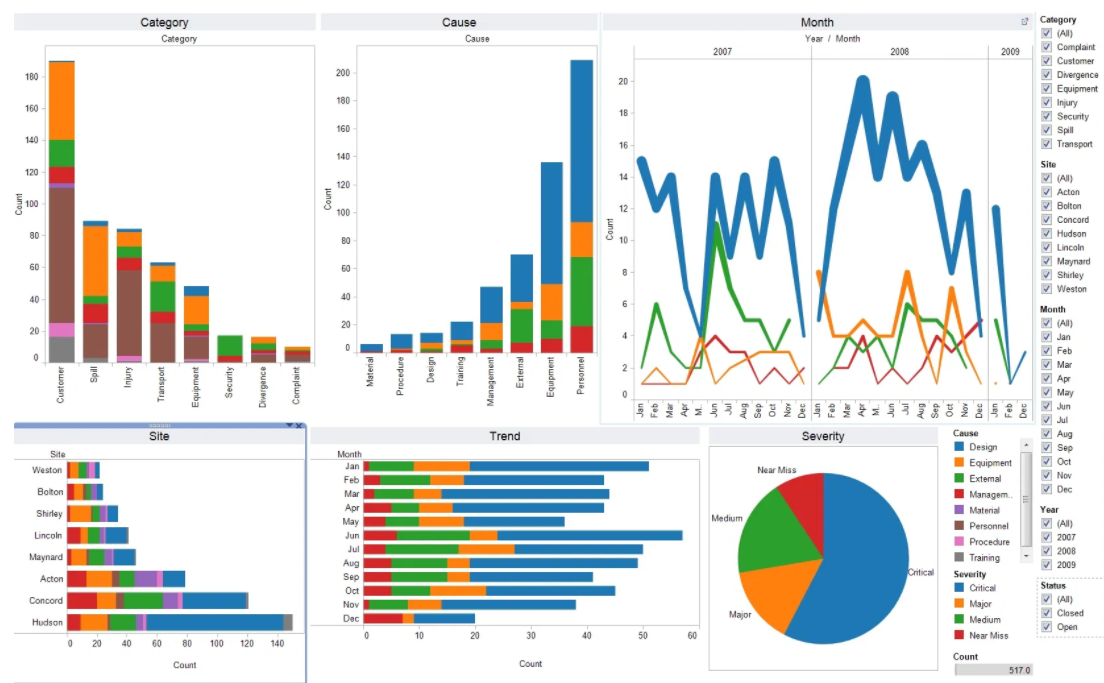
Data visualization is a super complicated domain of data science, commonly because it just seems very easy when its the hardest to perform. It combines multiple fields of communication, psychology, statistics with a singular motive of communicating the data in a simple yet effective and aesthetical way. Once you’ve derived the intended insights from your model, you have to represent them in a way that all the various key stakeholders of the particular project may understand. Though Data Visualization is a deep topic which you can learn easily in this course here(click here), we will mention some analysis and visualization tools like Tableau and Plotly that make it really easy to drag-and-drop your whole date into a visualization and manipulate efficiently to get more complex visualizations. Another mention would be D3.js, a JavaScript library for data visualization with HTML, SVG, and CSS.
Data Visualization using Python
7. Result Integration
The last step towards the data science life cycle is the consolidation part. Utilizing all the gathered insights that we have acquired from all the above steps of our data science lifecycle process, we have to consolidate the results so that its can be easily understood and analyzed or used well by the owners or organizations. The moment we have created visualizations, collected and analyzed the data, and come towards the end of making conclusions, we need to create files documents that validate our conclusions well.
Conclusion
Finally, we hope this comprehensive piece of guide would have helped you to understand all the phases of the Data Science life cycle, helping you in your data science project. Through this article we are trying to explain that data science is an exciting field that provides an immense potential to revolutionize the way we make certain important decisions and uncover all the previously inaccessible insights.